

About Urban Transport
| To develop traffic or the city? |
|
Life Cycle Approach | Life Cycle Cost |
|
Operating cost structure | Evaluating operating cost |
To develop traffic or the city?
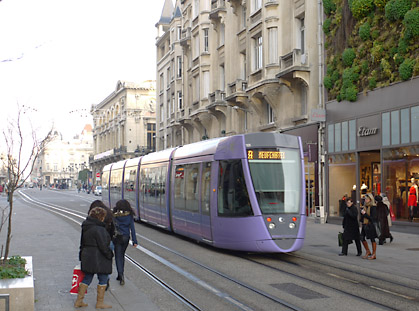
The new tram systems in Europe have changed the traffic system of the city, but also the city itself. Especially the city centre. And in many cases, this has been the purpose of implementing a tram. The idea has been to reshape the old city filled by cars to a common living room of the citizens. And that to enter the city is not only for those having a car and a driving license.
In many cases, when building a tram, the streets and in some cases also the facades of the buildings are redeveloped. When this redeveloping has been done together with the tram building, the cost may have been included into the cost of the tram. This may have caused the costs to double, making the tram to look very expensive. But in many European countries it is possible to tax the benefit the tram causes to cover the building costs. So everybody wins when business does better and the city can cover the cost of creating the base for doing well.
Another benefit is to be able to make the city grow to inside of itself. A tram is the most effective way to use the street space for traffic. This means, that along the tram route it is possible to build more apartments and business space as beside a car road. The benfit for the citizens is to shorten travelling time and distance and make the city's services better accessible. The benfit for the city is lower expences of public utilities like pipeline and cable networks and in other initial infrastructure building.
Life Cycle Approach
Public transport system or any of it's components are not disposables. Especially parts of rail transport systems are very long term assets. Rolling stock and trackwork including their structures use to have 30–50 years life time. During their life time there may become generated 3 to 5 times as much expenses as what was the purchase price of these assets.
Life Cycle Approach (LCA) is far wider idea than only Life Cycle Cost (LCC). Life Cycle Approach means that the coming life cycle will be taken into account already in the planning and design phase. Both structural and functional features will be based on the fact that the item will be in service for years, during which the operating environment and the components of the item itself may and will change.
Life Cycle Approach includes f.ex. life time maintenance and a plan for a possible extending of the life time. Also the planned refurbishment is part of Life Cycle Approach. As an example, IT-technology ages out within 5 to 8 years. And usually it is best both economically and functionally to renew IT equpments when aged out. This has to be taken to account in the structure of the main unit.
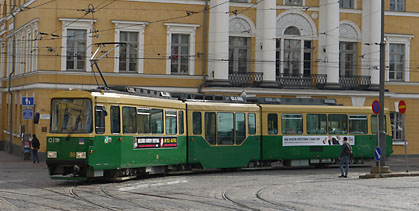
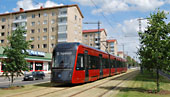
The articulated trams from 1970's of Helsinki City Transport are extended with a low floor middle section to extend the life cycle of the units.
Life Cycle Cost (LCC)
Life Cycle Cost (LCC) is an important subset of Life Cycle Approach (LCA). It is the economical part of LCA. It is a kind of a result of the plans and actions included in the life cycle of the system or parts of it, like rolling stock.
The main idea of LCC calculation is to find out the ratio between investments and the continuous expences during the life time. In the case of Tampere tram cars procurement, the LCC calculation indicated that the 29 million € lower purchase price ended up to 140 million € higher life cycle price. The lowest purchase price was the most expensive choice.
The importance of LCC in urban transport projects is displayed in the following example where urban rail and high capacity buses are compared. The volume in the comparison is typical for an European midle size city. A trunck line network of 22,5 kms with tram or bus service offering 2100 person peak hour capacity is compared.
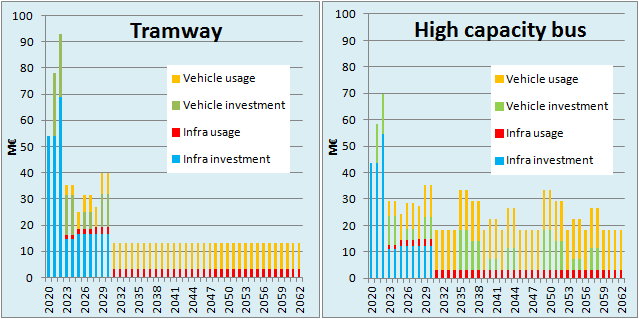
The comparison of Life Cycle Cost of a tram and a high capacity bus system. Each bar indicates the annual expences and the colors indicate the share of annual expences. Expences unit is in million Euros. Unit costs are based on the Tampere tram system contract prices.
The investment for a tram system is higher than investing to a high capacity bus system. The base investment is done during the first 3 years construction period. Then the system is expanded during the following 8 years. After expansion era tram system requires only usage cost that include mainenance and service. For the short life cycle of a bus the bus fleet needs to be replaced twice during the 40 years life cycle of the trams. And besides that, the usage of buses is more expensive than operating trams.
The legacy method of evaluating tenders in procurement is based on first phase investment price, which is only the first 3 bars in the figures above. Based on first phase, the tram is 54 million € or 31 % more expensive than bus.
After the 40 years service of the system, the cost of a bus system has required 236 million € more than the tram system. It is 26 % or average 6 million € per year more than the LCC of the tram system. The break even is after 15 years of operation, practically when the bus fleet requires the first replacement investment.
LCC evaluation avoids a mistake of 236 million €.
Operating cost structure
In the example above, the share of investment in LCC, both infrastructure and vehicles, is 46 % in case of the tram and 41 % in case of the bus system. The shares indicate the importance of being able to calculate the usage cost of the systems.
In public transport, the practice is to share the total cost to right of way cost and operating cost. Operating includes the investment to vehicles and the usage of vehicles, which includes maintenance, energy and driver labour.
The nominal cost of operation is the cost of operating one passenger place kilometer. This is the unit of public transport service production. The share of the components of operating cost for a place kilometer is shown in the illustrations below.
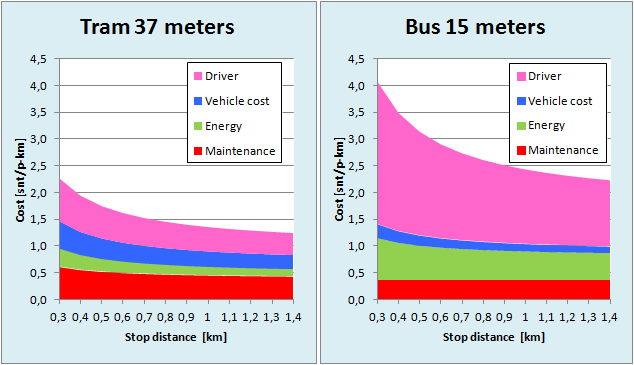
The comparison of nominal operating cost of a tram and a bus. The cost per one passenger place per one operated kilometer is displayed as a function of the stop distance. Tram cost is based on Tampere tram procurement. Bus cost is based on average 3-axle diesel bus service contracts in largest cities in Finland. Cost unit is Euro-cent per one passenger place kilometer.
From the illustrations above can be seen that buses are relatively inexpensive to buy and maintain. Energy cost of a bus is high and driver labour cost is very high. With the tram all the cost components are shared more even.
The high share of a driver cost in the bus is a consequence of the limited size of a bus. Though there is currently 24 meter double articulated buses in service, the increase of passenger capacity is relatively low compared to the increase of the length and cost of the vehicle. In Finland the cost optimum of the urban bus services is the 3-axle 15 meter bus.
In the Life Cycle Cos, the share of the vehicle investment is 21–22 % in case of tram and 8,8–9,6 % in case of a 15 meter bus. So what matters is the Life Cycle, not the investment cost of the vehicles.
Evaluating operating cost
In Finland the practice in purchasing bus operation services is to ask the tenderer to specify the pricing in 3 components:
- vehicle rent per operating day
- driver cost per operating hour and
- vehicle cost per driven kilometer.
This is for making possible to adjust the timetables during the contract period.
When purchasing urban rail operation services, the usual situation is that the city owns the rolling stock. The operator does not rent vehicles to the city, but the operator may be responsible for the energy and maintenance, as the cost of both may be a consequense of how the vehicles are operated. In this case the contract may include pricing in 2 components:
- driver cost per operating hour and
- vehicle cost per driven kilometer
Same as for urban rail is usually valid for fully electric buses. Both battery and trolley buses are bound to the local infrastructure. Therefore the city must carry the risk connected to the vehicle investment by purchasing the vehicles. In limited cases it is possible to sell rail vehicles or trolley buses to other cities. Battery buses are in early business phase (in 2018), therefore it is not known if battery buses may have real second hand market.
The following chart explains the comparison of the pricing in system level.
| Diesel bus | Elecric bus | Rail | |
|---|---|---|---|
Daily price |
Operating day. Vehicle rent, insurance, building rental, administration |
Calendar day. Vehicle installment, insurance |
Calendar day. Vehicle installment, (insurance) |
Hour price |
Driver and foreman salaries | Driver and foreman salaries | Driver and foreman salaries |
Kilometer price |
Maintenance, energy | Maintenance, energy | Maintenance, energy |
Right of way |
(Included in city's street maintenance) | Installment and maintenance of electric equipment and separate right of way | Installment and maintenance of track |
Depot + workshop |
(Included in daily price) | Installment and real estate expences | Installment and real estate expences |
Administration |
(Included in daily price) | Administrative work | Administrative work |
Expenses caused from the contracting of public transport systems. When contracting diesel bus serivces, all the service is paid in 3 price components of the contract. Those expenses shaded with gray in the chart column ”Diesel bus” are paid either included in the pricing of the bus service contract or as a part of street maintenance expences. Also it is important to understand that for diesel buses the rent is paid only for operating days. With electric buses and rail investment must be paid for each calendar day. So ”Daily price” of a diesel bus is not equivalent to that of electric bus or rail system.
When there is a need to evaluate operating cost, the only valid way to do it is to calculate the Life Cycle Cost. This is because in case of rail or electric bus, hiring of vehicles and required facilities like depot and workshop capacity and charging stations is not possible. These can not be targeted to day and to a single vehicle because it is a classic mistake by mixing variable and fixed costs.
Original page 18.10.2017. Latest update 15.4.2018.